Market Crash And FIRE Runway
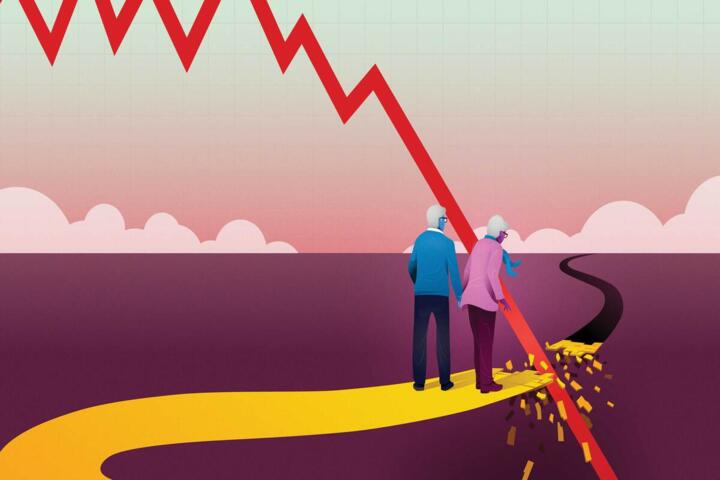
FIRE runway measures how long your portfolio can fund spending before you need earned income again. A market crash changes runway through two channels: the portfolio value drops immediately, and future returns may arrive after you have already sold shares at lower prices. That second effect is often called sequence-of-returns risk, and it matters most when you start withdrawals near the downturn.
To make the impact concrete, treat the crash as a one-time drawdown and then assume you keep withdrawing at a fixed annual rate. A -20% drop reduces your starting balance, while the same withdrawals during the recovery phase can compound the damage. The exact runway change depends on your withdrawal rate, asset mix, and whether the crash happens right at the start of retirement or after several years of withdrawals.
For readers who like numbers, a quick rule of thumb exists: if you withdraw a constant amount and returns are temporarily weak, runway often scales roughly with the portfolio’s remaining value. That rule breaks when returns rebound strongly or when you can cut spending during the drawdown, which is why stress-testing assumptions beats relying on a single scenario.
Common Mistakes And Hidden Dependencies
People often model a crash as “portfolio drops, then everything resumes,” while ignoring the timing of withdrawals. If you withdraw monthly, a -30% drawdown that lasts 12–18 months can force more selling at depressed prices than a crash that bottoms quickly. The difference shows up even if the final low-to-high recovery looks similar on a chart.
Another frequent error involves mixing up withdrawal rate and spending rate. Your withdrawal rate might be 3.5% of the starting portfolio, but your spending rate is what you actually need to pay bills. If you keep spending flat in nominal terms while the portfolio shrinks, the effective withdrawal rate rises, and runway shortens.
Asset allocation also changes the math. A portfolio with 60/40 equity/bond exposure behaves differently from one with 100% equities during the same drawdown. Bonds can cushion volatility, but they can also lose value when interest rates rise, which is why “bonds always protect you” fails in certain regimes.
Taxes and account location add another dependency. A crash can reduce taxable account gains, but withdrawals may still trigger taxes depending on cost basis and dividend treatment. If you live in the U.S., the order you draw from taxable, Roth, and traditional accounts affects both cash flow and long-term compounding. Even a small change in marginal tax rate can shift runway by months, not years, but it can still matter.
Finally, many plans assume a fixed “safe withdrawal rate” without checking the plan’s internal consistency. If you use a 4% rule but your actual spending rises with inflation and your portfolio includes high-fee funds, the plan’s implied withdrawal rate drifts. I’ve seen spreadsheets where the inflation adjustment was applied to spending but not to withdrawals, which quietly breaks the scenario.
Stress-Test Steps For Each Drop
1) Translate Drop Into Runway
Start with your current annual spending need in today’s dollars, then model a crash at the beginning of retirement. Example: if you need $60,000 per year and your portfolio is $1,000,000, your initial withdrawal rate is 6%. A -20% crash reduces the portfolio to $800,000, and the same $60,000 withdrawal becomes 7.5% of the new balance. If you assume no growth during the first year, runway shrinks roughly in proportion to the balance, but with growth assumptions you’ll get a more realistic estimate.
For a simple stress test, run three scenarios where you apply -20%, -30%, and -40% to the portfolio value at the start of withdrawals. Then apply your expected real return assumptions for the next 5–10 years. Use a conservative real return for equities-heavy mixes and a lower real return for bond-heavy mixes if you expect rate volatility. If you use a spreadsheet, label the assumptions clearly and version the file; I’ve used a “FIRE_runway_v3_2026-09” sheet because it prevents accidental edits to the baseline.
2) Model Sequence Risk With Withdrawal Timing
Sequence risk depends on when the crash occurs relative to withdrawals. If you withdraw monthly, you can approximate the effect by assuming the portfolio follows a path rather than a single point drop. A practical method: assume the portfolio declines linearly to the trough over 12 months, then recovers to the pre-crash level over the next 24 months. This is not a prediction, just a way to capture the “sell low” effect.
Tools can help here. A retirement calculator that supports Monte Carlo simulations can show distribution ranges, but you still need to sanity-check inputs like inflation, fees, and tax assumptions. If you use a Monte Carlo tool, record the random seed or at least the run settings; some calculators change outputs when you rerun with different defaults, which can make comparisons misleading.
3) Add Flexibility: Spending And Rebalancing
Runway improves when you can reduce spending during the drawdown. Even a temporary 10% cut to discretionary spending can extend runway meaningfully if the cut happens early. The mechanism is simple: lower withdrawals reduce the number of shares you sell at depressed prices, which slows the portfolio’s decline.
Rebalancing can also matter, but it’s not automatic. If you rebalance by selling assets that have fallen less and buying those that have fallen more, you may increase expected future returns, yet you must consider transaction costs and tax impacts. In taxable accounts, selling to rebalance can trigger capital gains; in that case, rebalancing using new contributions or dividends may be more tax-efficient, though it depends on your cash flow.
Set a “decision rule” before volatility hits. For example: if the portfolio drawdown exceeds a threshold, you pause discretionary spending growth for 6–12 months and redirect dividends to the underweight asset class. This kind of rule reduces the chance you react emotionally during the worst weeks.
4) Use Realistic Numbers For Fees And Taxes
Fees reduce compounding every year, and the effect becomes more visible during drawdowns because the portfolio base is smaller. Use your actual expense ratios and any platform fees. If you hold multiple funds, compute a weighted average fee rather than using a single number from memory.
Taxes depend on jurisdiction and account types. In the U.S., long-term capital gains rates and qualified dividend treatment can lower tax drag in taxable accounts, but withdrawals from traditional retirement accounts are generally taxed as ordinary income. If you plan to retire early, you may also face rules around early withdrawals and penalty exceptions. The safest approach is to model taxes conservatively and then adjust once you confirm your expected bracket.
As a side observation: some FIRE calculators assume a flat tax rate, which can misstate outcomes when your income crosses thresholds. If you want a more grounded estimate, use your last two years of tax returns to approximate your marginal rate and dividend/capital gains mix.
Educational Case Examples
Scenario A: Equity-Heavy Early Retirement
A couple plans to retire in 2027 with $900,000 in a 90/10 stock/bond portfolio. They need $48,000 per year in today’s dollars and plan to withdraw monthly. In the -20% crash scenario, the portfolio drops to $720,000 at retirement start, raising the effective withdrawal rate from 5.3% to 6.7%. If returns are weak for the first few years, their runway shortens more than the simple -20% would suggest because withdrawals continue while the portfolio is still rebuilding. In the -30% scenario, the effective withdrawal rate becomes 7.6%, and the probability of needing a part-time income bridge increases.
Scenario B: Balanced Portfolio With Spending Flex
An individual retires with $600,000 in a 60/40 portfolio and spending of $36,000 per year. They set a rule to cut discretionary spending by 10% for 12 months if the portfolio drawdown exceeds 25%. Under a -20% crash, the rule does not trigger, and runway declines modestly. Under -30% and -40% crashes, the rule triggers early, reducing withdrawals and slowing the portfolio decline. The outcome still worsens at -40%, but the gap between -30% and -40% is smaller than it would be without flexibility.
These examples show why the same crash percentage can produce different runway outcomes. The portfolio mix, withdrawal timing, and the ability to adjust spending during the drawdown drive most of the difference.
Runway Impact Checklist
| Scenario | Portfolio Drop | Effective Withdrawal Rate | What To Check Next |
|---|---|---|---|
| Conservative | -20% | Multiply by 1 / 0.80 | Do you cut spending or keep it flat? |
| Stress | -30% | Multiply by 1 / 0.70 | Does your tax bracket change with withdrawals? |
| Severe | -40% | Multiply by 1 / 0.60 | Can you bridge with part-time income or cash reserves? |
Step-by-step checklist you can run in a spreadsheet:
- Record annual spending in today’s dollars and split it into fixed and discretionary buckets.
- Apply -20%, -30%, and -40% to the portfolio value at retirement start.
- Compute the new effective withdrawal rate for each scenario using your spending amount.
- Model a simple withdrawal path (monthly selling) for at least 24–36 months to capture sequence risk.
- Test one flexibility lever: a 5–10% discretionary cut or a temporary income bridge.
- Re-run with a higher fee assumption (for example, add 0.25% to expense ratios) to see how sensitive runway is.
- Re-run with a conservative tax assumption for taxable withdrawals if you have taxable assets.
Common Mistakes That Skew Results
One mistake is using a single “crash year” return and ignoring the path. A -30% peak-to-trough with a fast recovery can produce a different runway than the same peak-to-trough with a slow recovery, because withdrawals happen throughout the period.
Another mistake is assuming you can rebalance without tax friction. In taxable accounts, selling to rebalance can create capital gains, and the tax bill can arrive in the same year as the sale. If you do not model that, the plan may look safer than it is.
People also over-trust inflation assumptions. If spending rises faster than the inflation index used in your plan, the effective withdrawal rate climbs. If you track spending in categories, you can separate health-related costs, housing costs, and discretionary spending that often behaves differently.
A mild frustration point: many FIRE spreadsheets hide assumptions in cells labeled “inputs” with no explanation. When you revisit the file months later, you may not remember whether the inflation adjustment applied to withdrawals, spending, or both. Versioning and a short “assumption log” at the top of the sheet prevents that.
FAQ
How does a -20% crash change runway?
A -20% drop reduces your portfolio to 80% of its starting value, so the effective withdrawal rate rises by about 25% if spending stays flat. Runway depends on returns after the crash and whether you adjust spending or withdrawals during the drawdown.
Why does a -40% crash hurt more than the percentage suggests?
A -40% drop leaves 60% of the starting portfolio, raising the effective withdrawal rate by about 67% if spending stays unchanged. If the crash coincides with early withdrawals, sequence-of-returns risk increases the damage because you sell more shares at lower prices.
Should I assume the crash happens at retirement start?
For stress testing, yes. The worst timing for withdrawals is often near the start of retirement because you have less time to recover before withdrawals deplete the portfolio.
Do bonds always protect FIRE plans?
Bonds can reduce equity volatility, but bond prices can fall when interest rates rise or credit spreads widen. The bond cushion depends on duration, credit quality, and the specific rate environment during the downturn.
What actions extend runway during a crash?
Spending flexibility, a temporary income bridge, and careful withdrawal ordering can extend runway. Rebalancing can help, but taxable account constraints can limit the benefit if you trigger capital gains.
Author's Insight
Market crash effects on FIRE runway come from arithmetic and timing: a drawdown reduces the portfolio base, and withdrawals during weak markets can lock in losses. The most reliable way to estimate impact uses a withdrawal path model rather than a single “drop then recover” point. Tax treatment and account order often shift outcomes enough to matter, even when market returns look similar. If you want a defensible plan, stress-test -20%, -30%, and -40% with at least one spending-flex scenario and one conservative fee/tax assumption.
Key Takeaways
- A -20%, -30%, or -40% crash raises your effective withdrawal rate by about 25%, 43%, and 67% respectively if spending stays flat.
- Sequence-of-returns risk depends on when withdrawals occur, so model a path, not only a peak-to-trough number.
- Spending flexibility and a temporary income bridge can shrink the runway gap between scenarios.
- Fees, taxes, and account order can change runway estimates, so use conservative assumptions and verify them against your actual situation.